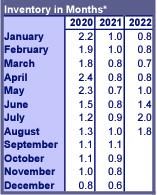
Inventory in months decreased in August to 1.8.
Comparing the first eight months of 2022 to the same period in 2021, new listings (27,629) decreased 6.0%, pending sales (20,730) decreased 16.9%, and closed sales (20,434) decreased 11.7%.
Comparing 2022 to 2021 through August, the average sale price has increased 8.6% from $570,100 to $619,200. In the same comparison, the median sale price has increased 8.9% from $505,000 to $550,000.
Inventory decreased to 1.8 months in August. This is a number we pay close attention to as it tends to be a simple indicator of what the market is doing. Total average time on market increased to 28 days.
If we can answer questions about this, please be in touch.
The following summary shows the number of homes available for immediate purchase and occupancy. Portland Metro Market Action Addition: August 2022 Total Active Listings* Reported in Market Action: Less Listings with Purchase Contingencies*:
Readily Purchased Listings: 4,715
Less Listings with Purchase Contingencies*: 86
Readily Purchased Listings: 4,629
Percent of Total Active Listings: 98.2%
Less New Under Construction (not ready for occupancy): 342
Less New Proposed (not started): 122
Total Readily Purchased & Occupied Listing: 4,165
Percent of Total Active Listings: 88.3
Inventory in Months of Readily Purchased & Occupied Listings: 1.6