The question of value is a function of supply and demand. Is demand strong enough to absorb the present, or rising, level of available inventory? It seems to be.
The graphs below compare new inventory (listings) and market demand (pending) for the first 19 weeks of 2021 and 2022 respectively. You’ll see that the YTD and PYTD trends have roughly the same trend in both graphs. Absolute numbers indicate 474 fewer listings (about 24 less per week) and 1,065 fewer pending transactions (53 per week) in 2022 than in the same 20-week period of 2021.
The third graph below reflects the average 30-year mortgage rate in 2021 and 2022 YTD during the same period. By the 20th week of this year interest rates were up nearly 75% over the same week in the prior year.
Midway through March of this year, interest rates began rising rapidly, a trend that continues through the present. We are roughly ten weeks into a significant rising rate environment. So far, however, considerable demand continues to persist.
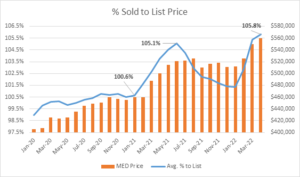
The below graph Illustrates, that even with the upward trend of interest rates, last month the average property sold for 105.8% of the list price, marking the highest point on record in the metro area. Median prices hit an all-time high of $560,000, and the absorption rate reached nearly 93% for the year (absorption is measured by dividing pending transactions into listed properties.
So far, the answer seems to be yes.